Strayer University - MAT 300 Unit 2 Milestone 2 Exam. Questions And Answers. For a class reading competition, the students were asked to read a book.
... [Show More] Mike, Jack, and Rayon discussed the
numbers of pages they read on the first day. One of them made a graph to represent the data.
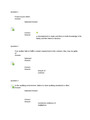
Who made the graph, and why?
Rayon, because he wanted to make the amount read by each person appear very different.
Jack, because he wanted to make it look like he read significantly more than the others.
6/29/2020 Sophia :: Welcome
https://www.sophia.org/spcc/introduction-to-statistics-2/milestone_take_feedbacks/4317780 2/21
Mike, because he wanted to make the amount read by each person appear reasonably close.
Mike, because he wanted to accurately show the amount read by each person.
RATIONALE
Since there was a competition, the person who most likely made this graph would want to represent themselves
favorably. Since Jack has the most pages, it would probably be him.
CONCEPT
Misleading Graphical Displays
2
In which of these cases should the mean be used?
When the data is left-skewed
When the data is symmetric
When the data has extreme values
When the data is right-skewed
RATIONALE
Since the mean uses the actual values in the data, it is most affected by outliers and skewness. So, we only want
to use the mean when the data is symmetric as a measure of centrality. When the data is skewed, the median is a
better measure.
CONCEPT
Measures of Center
3
A fast-food restaurant gave a “Customer Satisfaction Survey” in which 1500 customers rated how satisfied they
were with service. The results are shown below as a table.
Rating Frequency
Extremely Satisfied 234
Satisfied 443
6/29/2020 Sophia :: Welcome
https://www.sophia.org/spcc/introduction-to-statistics-2/milestone_take_feedbacks/4317780 3/21
Rating Frequency
Neutral 246
Dissatisfied 203
Extremely Dissatisfied 374
The relative frequency of people who were dissatisfied with the service is __________.
20.3%
29.5%
38.5%
13.5%
RATIONALE
To get the relative frequency, we take the frequency of the value and divide it by the total number. So in this case
for strongly dissatisfied, the relative frequency would be:
CONCEPT
Frequency Tables
4
Sara wonders what percentage of her students answered at least half of the quiz questions incorrectly.
6/29/2020 Sophia :: Welcome
https://www.sophia.org/spcc/introduction-to-statistics-2/milestone_take_feedbacks/4317780 4/21
The relative cumulative frequency of students who earned a score of 20 or lower on the quiz is __________
.
68%
28%
14%
34%
RATIONALE
To get the relative frequency of 20 or lower, we need to find the cumulative number of 20 or less. We simply
add up any bin that has the number 20 or less, such as the bin that shows scores of 1-5, 6-10, 11-15, and 16-20.
This would be:
6/29/2020 Sophia :: Welcome
https://www.sophia.org/spcc/introduction-to-statistics-2/milestone_take_feedbacks/4317780 5/21
To get relative frequency, we will take this cumulative number and divide it by the total number of students.
CONCEPT
Cumulative Frequency
5
The formula for the standard deviation of a sample is:
Select the true statement for the following data set that has a mean of 6.75:
4, 6, 7, 10
Answer choices are rounded to the hundredths place.
The variance is 6.75 and the standard deviation is 6.25.
The variance is 6.25 and the standard deviation is 2.50.
The variance is 2.50 and the standard deviation is 6.50.
The variance is 4.71 and the standard deviation is 2.17.
RATIONALE
We can first calculate the variance of the data, , by using the part of the formula under the square root:
Next, we can find the standard deviation, , by simply taking the square root of the variance:
We can also use the statistical functions in Excel to quickly find the variance and standard deviation.
6/29/2020 Sophia :: Welcome
https://www.sophia.org/spcc/introduction-to-statistics-2/milestone_take_feedbacks/4317780 6/21
CONCEPT
Standard Deviation
6
The first quartile (Q1) value from the above box plot is __________.
65
40
47
54
RATIONALE
Note the value for Q1 is the left edge of the box, which is 47.
CONCEPT
Five Number Summary and Boxplots
7
Let x stand for the percentage of an individual student's math test score. 64 students were sampled at a time.
The population mean is 78 percent and the population standard deviation is 14 percent.
What is the standard deviation of the sampling distribution of sample means? [Show Less]