Sophia Learning, College
Algebra, Milestone 3, WITH
ANSWERS
1
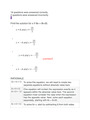
The graph of a linear function passes through the points
and .
Find the slope of this
... [Show More] function.
•
•
•
•
CORRECT
RATIONALECONCEPT
Determining Slope
2
The prices for a loaf of bread and a gallon of milk for two
supermarkets are shown below.
Since we have two points from a linear function, we can
use the slope formula to find the slope of the line.
Now that the numbers are plugged in, evaluate the
subtraction in both the numerator and the denominator.
In the numerator, the difference in coordinates is
minus , or . In the denominator, the difference in
coordinates is minus , which is the same as plus
, or . The slope of the line is .
The slope is the difference in coordinates from the two
points divided by the difference in coordinates from the
same two points. When plugging in the values it is
important to be consistent with which coordinates are
subtracted in the calculations.
A B
Bread $2.20 $2.50
Milk $3.60 $3.40Mary needs to buy bread and milk for her church picnic. At
Supermarket A, she would pay $44.20. At Supermarket B, she
would pay $44.70.
Which of the following system of equations represents this
situation?
•
•
CORRECT
•
•
RATIONALE
In general, the equation to represent the
total cost of buying bread and milk would
be the sum of the cost for bread and cost
for milk. To find the cost of bread and
milk, first define variables to represent the
amount of bread and milk.
Here, will represent bread, and will
represent milk. Both and will be
multiplied by their respective prices.CONCEPT
Writing a System of Linear Equations
3
Select the correct slope and y-intercept for the following linear
equation:
•
CORRECT
•
•
At Store A, a loaf of bread costs $2.20,
and a gallon of milk costs $3.60. We also
know that the total cost at Store A is
$44.20. So the total cost at Store A would
be expressed with this equation. We can
construct a similar equation for Store B.
At Store B, bread cost $2.50 per loaf, and
milk costs $3.40 per gallon. We also know
that the total cost at Store B is $44.70.
The total cost at Store B would be
expressed with this equation.
This is the system of equations to
represent the costs of bread and milk at
Store A and B.•
•
•
RATIONALE
CONCEPT
Forms of Linear Equations
4
Consider the region shaded in yellow.
Equations in the form allow us to easily
identify the slope and y-intercept. The slope is given by
the variable , and the y-intercept is given by the
variable .
The variable is the coefficient in front of x that
represents the slope. In the equation , the
coefficient in front of is , so is the slope.
The variable represents the y-coordinate of the yintercept. In the equation , 8 will be the ycoordinate of the y-intercept. Remember that the xcoordinate of the y-intercept is always 0, so the yintercept is .Which inequality does the shaded region represent?
•
•
•
•
CORRECT
RATIONALE
Writing a linear inequality from a graph is
similar to writing a linear equation from a
graph. The biggest difference is that with
inequalities, a portion of the coordinate
plane is highlighted to represent the
solution region. Start by focusing on the
line that we see. Determine the yintercept and slope so that we can write
an equation in slope-intercept form.
The graph intercepts the y-axis at (0,3) so
this is our intercept. To find the slope, we
can use this point and another point on
the line, for example, (-2,-1).
Plugging these two points into the slope
formula, we get a slope of 2. We can write
an equation in the form y = mx + b, where
m is the slope and b is the y-coordinate of
the y-intercept.CONCEPT
Writing a Linear Inequality from a Graph
5
A line passes through the point and has slope of .
Find the equation of this line.
•
•
•
Using the slope of 2 and the y-intercept of
3, we get the equation y = 2x + 3. Next,
we need to turn this equation into an
inequality. To do this, note two things: the
type of line used to graph the inequality,
and the highlighted solution region. The
graph has a solid line, which means that
the inequality symbol is either≤or≥. To
decide between≤or≥, determine whether
the region above or below the line is
highlighted. Since the region BELOW the
line is highlighted, the inequality symbol is
“less than or equal to”,≤.
Because the line is solid and the region is
shaded below the line, the inequality y≤
2x + 3 corresponds to this graph.•
CORRECT
RATIONALE
CONCEPT
Writing a Linear Equation Using Slope and Points
6
has been substituted for , has been plugged in
for , and has been substituted for . Next,
evaluate the left side of the equation.
is equivalent to . Now, distribute with
the values in the parentheses, .
When we are given a point and slope, we can use the
point-slope formula, , to find the
equation of the line. We can plug in the point
for and , respectively, and the slope of for .
times equals and times equals . To
isolate on the left side, subtract from both sides.
Subtracting from the left side leaves only . On the
right side, subtracting from equals . An
equation of a line that passes through the point
and has a slope of is .The cost of a small business is given by the
expression where is the number of units produced.
The business will be profitable whenever its profit exceeds its
cost.
If the profit region is shaded in purple, which of the following
graphs corresponds to the given situation?
B IS CORRECT•
•
•
•
RATIONALESince the business will be profitable
whenever its profit exceeds the cost, we
want the region ABOVE the boundary
line. This narrows our choices to one of
these two graphs. Next, determine
whether this is a strict or non-strict
inequality. In a strict inequality, the shaded
area cannot equal the line, so the line is
dashed. With a non-strict inequality, the
shaded area can equal the line, so the
line is solid. The shaded area for profit
must exceed the cost, so the boundary
line must not be included. This indicates
that the situation must be represented
with a dashed line.
OR
The cost of a small business is given by
this expression, where is the number of
units produced. The business will be
profitable whenever its profit, , exceeds
the cost. To find the corresponding graph,
first determine whether the profit region
lies above or below this boundary.CONCEPT
Using Linear Inequalities in Real World Scenarios
7
The equation of a line is .
What would be the slope of a line perpendicular to this line?
•
•
•
CORRECT
This graph shows when the business is
profitable.•
RATIONALE
CONCEPT
Introduction to Slope
8
When flipping the fraction, the original
numerator, , becomes the new denominator,
and the original denominator, , becomes the
new numerator. Since the original slope was
positive, the new slope is negative. The slope
of a line that is perpendicular to
would be .
Lines that are perpendicular have slopes that
are opposite reciprocals of each other. First
determine the slope of the original line.
Remember that when a line is in the form
, represents the slope, and
represents the y–intercept.
In this equation, the slope is . Now that we
know the slope of the original line, find the
slope of a perpendicular line by calculating
the opposite reciprocal.Consider the following system of two linear equations:
Select the graph that correctly displays this system of equations
and point of intersection.
B is correctt•
•
•
•
RATIONALE
Start by graphing each equation in the
system. Then we will identify the
intersection point.The equation simplifies to .
This tells us that the y-intercept is
at and the slope is .
Subtracting from both sides leaves
only on the left. Then divide both sides
by to isolate .
Starting with the first equation, we want to
isolate the variable onto one side of the
equals sign. First, subtract from both
sides.
On the left, is now isolated. Simplify the
right side by dividing each term by .
Re-writing each equation in the
form will help us easily identify
the y-intercept and the slope to graph
each line.
This graph shows a y-intercept at
and a slope , meaning we need to go
down two and to the right three to plot a
second point. Connecting these two
points makes this line. Repeat these
steps with the second equation.CONCEPT
Solving a System of Linear Equations by Graphing
9
The goal is to isolate the variable onto
one side of the equals sign. First, subtract
from both sides.
On the left, is now isolated. Simplify the
right side by dividing by .
Subtracting from both sides leaves
only on the left. Then divide both
sides by to isolate .
The equation simplifies to . This
tells us that the y-intercept is at and
the slope is .
This graph shows a y-intercept at
and a slope , meaning we need to go
up two and to the right three to plot a
second point. Connecting these two
points makes this line.
Once both lines are plotted, you can see
the point of intersection at .Tamara has $30,000, part or all of which she wants to invest into
a combination of corporate bonds and municipal bonds. She
wants to invest no less than $8,000 into corporate bonds, and at
least three times as much into corporate bonds than into
municipal bonds.
Let be the amount invested in corporate bonds, and let be the
amount invested in municipal bonds.
Which system of inequalities describes Tamara’s investment
options?
•
•
•
•
•
correct
RATIONALE
Let be the amount invested in corporate
bonds, and let be the amount invested in
municipal bonds. We can represent the
restrictions with a system of inequalities. One
of the limitations is the total amount Tamara
wants to invest. Tamara wants to invest up to
. To write this inequality, express the
total amount of money Tamara wants to invest,
and restrict it to less than or equal to .
This inequality shows that the amount invested
in corporate bonds plus the amount invested in
municipal bonds must be less than or equal to
. Another restriction is that
Tamara wants to invest no less than
into corporate bonds. “No less than” means
that we can include the exact value of the
limitation.CONCEPT
Writing a System of Linear Inequalities
10
In 2000, the total population of the U.S. was 281.4 million people.
In 2010, it was 308.7 million people. (Source: www.census.gov)
What is the average rate of change in the total population over
this time period?
•
27.3 million people per year
•
13.6 million people per year
•
1.36 million people per year
“At least” means that we can include the
limitation. Use the “greater than or equal to“
symbol,≥, to show this inequality.
This system of inequalities describes Tamara's
investment strategies.
This inequality means that Tamara can invest
or more in corporate bonds. The last
restriction is that Tamara wants to invest
at least three times as much into corporate
bonds than into municipal bonds. We can
create an equality that states the amount in
corporate bonds, , is at least three as much
as the amount in municipal bonds, or .•
2.73 million people per year correct
RATIONALE
CONCEPT
Slope in Context
divided by equals . The
average rate of change in the population
between and is million
people per year.
The change in population is the difference
between and , or
. The change in years is
the difference between and ,
or . Next, evaluate the
subtraction in the numerator and
denominator.
The average rate of change can be
computed like slope. It is the change in
population divided by the change in years.
The population changed from
million in , to million in .
equals ;
equals . The average
rate of change is , which can be
simplified.11
Select the line that is equivalent to .
•
•
•
correct
•
RATIONALE
To convert from standard form to slope-intercept form, we
need to isolate onto one side of the equation. We will
do this by applying inverse operations to both sides of the
equation. To start, subtract from both sides, which will
start to isolate on the left side.CONCEPT
Converting Between Forms
12
The graph of a function is shown here.
On the left, the and cancel, leaving only . On
the right, we have minus , which we can rewrite as
(which follows the form ). To isolate ,
divide both sides of the equation by .
On the left, is isolated. On the right, we can divide
and by separately.
divided by is equal to . divided by is
. The equation can be rewritten as
.Which equation corresponds to this graph?
•
•
correct
•
•
RATIONALEOnce we have the points plugged into the formula, we
can evaluate both the numerator and denominator.
We can use the y-intercept at and another point
on the line, . To find the slope, use the slope
formula which states that the slope is the difference
in values divided by the difference in values.
We can easily identify the y-intercept by examining
when the line crosses the y-axis. This occurs at
so this means that is the variable in the equation.
The form is called slope-intercept form. To
identify the equation of this graph in slope-intercept
form, we need to identify two parts to the line: its
slope, noted by the variable ; and its y-intercept,
noted by the variable . Let's start by finding the yintercept.
Now that we have the y-intercept, we can find the
slope, . We need to calculate the rise over run
between two points on the graph. First, let's identify
two points.
In the numerator, minus is . In the
denominator, minus is . Then, simplify the
fraction.CONCEPT
Writing an Equation from a Graph
13
It took Mike 5.625 hours to travel over pack ice from one town in
the Arctic to another town 180 miles away. During the return
journey, it took him 10 hours.
Assume the pack ice was drifting at a constant rate, and that
Mike’s snowmobile was traveling at a constant speed relative to
the pack ice.
What was the speed of Mike's snowmobile?
•
13 miles per hour
•
22 miles per hour
•
7 miles per hour
•
25 miles per hour correct
RATIONALE
The fraction simplifies to just , which is the
slope of the equation. We can put both parts together
to find the full equation.
The y-intercept is at and the slope is , so the
equation of the line is .When two rates work together, add the two
rates. When two rates work against each other,
the opposing rate is negative, which produces
an expression involving subtraction. To solve
this problem, set up a system of two equations.
It took Mike hours to travel over pack ice
from one town to another town miles away.
During this trip, he traveled in the same
direction as the drifting ice. During his return
journey, it took him hours to go the same
distance. The return trip back was made in the
opposite direction of the drifting ice. Two rates
are involved in this problem: the rate of Mike’s
snowmobile and the rate of the drift of the pack
ice.
Both equations must be written in the form of
, which states that distance is equal to
rate times time. Use the combined rates for the
variable.
We can identify Mike’s rate as , and the rate
of the drifting ice as . Next, consider the
combined speed when the rates work together
and when they work against each other.CONCEPT
Distance, Rate, and Time in a System of Equations
14
In the first equation, divide both sides by
, which equals on the left side and
leaves on the right side. In the second
equation, divide both sides by , which equals
on the left side and leaves on the
right side. To solve for the rates, add the two
equations.
For the first trip, the distance, , is miles,
the combined rate is , and the time, , is
hours. On the trip back, the distance, ,
is miles, the combined rate is , and
the time, , is hours. Next, simplify the
system of equations by dividing each equation
by its respective time.
Dividing by equals . The rate of Mike’s
snowmobile, , is 25 miles per hour.
Adding the two equations together, the
constant terms on the left side, and , sum
to . The terms in each equation add to
and is eliminated. To solve for , divide both
sides by 2.Abby can buy individual songs for $1.00 to download. Or she can
download an entire album for $8.00. Abby can spend no more
than a total of $50. She wants to buy at least two albums, and no
more than 30 individual songs. The following system of
inequalities represents this situation, where is the number of
individual songs and is the number of albums.
Which yellow shaded region corresponds to Abby’s possible
choices?
D IS CORRECT•
•
•
•
RATIONALE
The given situation can be expressed with
these inequalities. To find the area that
represents the solution, we will need to
graph each inequality. Let's start with
. To graph this inequality, we
need to graph it as a line. We can do this
by finding the and intercepts.This is the graph of the line that contains
the points and . Next, we
need to graph this as an inequality. Since
Abby wants to spend only up
to dollars, we will shade everything
BELOW the line.
This represents the inequality .
Now, we can graph the other two
inequalities, and .
The intercept is the coordinate point
when . When substituting this value
in for , we get an intercept of .
The intercept is the coordinate point
when When substituting this value
in for , we get a intercept of .
Next, plot these two points and graph the
line.CONCEPT
Solving Systems of Linear Inequalities by Graphing
15
Consider the following table.
The area that includes all three
inequalities is just this shaded area.
For the inequality , this tells us that
Abby wants to buy no more than
individual songs. This is represented with
a line at and we will shade
BELOW, or to the LEFT, of the line.
For the inequality , this tells us that
Abby wants to buy at least albums. This
is represented with a line at and we
will shade ABOVE the line.Which graph corresponds to this table?
C is correct
•
•
•
•
RATIONALE
When given a table of points, we can
match the and values with the
coordinate points on the graph.
Remember, the value indicates the
distance the point moves left (negative) or
right (positive) from the origin, . The
value indicates the distance the point
moves up (positive) or down (negative)
from the origin.CONCEPT
Graph of a Line
16
Select the solution to the following system of equations:
•
•
correct
For , move three points to the right
and 14 points up from .
For , move two points to the
left and 11 points down from .
For , move one point to the right and
four points up from .
For , only move one point down
from .
For , move four points to the
left and 21 points down from .•
•
RATIONALE
Before you can add equations, sometimes
you must multiply entire equations by a scalar
value for the method to work as intended. For
this system, we can multiply the second
equation by .
Here, by multiplying by , the
result contains a term, which will cancel
when combined with the second equation.
Now, we can add the two equations together.
When we add the two equations, the term
will cancel, leaving . Now we can
solve for by dividing both sides by .
Once we divide both sides by , we get a
solution of . We can solve for by
plugging in for in either equation.CONCEPT
Solving a System of Linear Equations using the Addition Method
17
On his way home from the school board meeting, Kevin fills up his
car. He likes the idea of using gasoline with ethanol, but thinks his
car can only handle 25% ethanol. At the gas station, he can use
regular gas with 10% ethanol or E85 fuel with 85% ethanol.
How many gallons of each type of fuel should Kevin use if he
wants to fill up his car with 10 gallons of fuel containing 25%
ethanol?
•
7 gallons of regular gas with 10% ethanol;
• 3 gallons of E85 fuel with 85% ethanol
•
3 gallons of regular gas with 10% ethanol;
This is the solution to the system of equations.
Let's use the first equation . Once
is plugged in for , evaluate and solve for by
subtracting from both sides.
This now leaves on the left side. Finally,
divide both sides by .
Dividing by gives a solution of .• 7 gallons of E85 fuel with 85% ethanol
•
2 gallons of regular gas with 10% ethanol;
• 8 gallons of E85 fuel with 85% ethanol
•
8 gallons of regular gas with 10% ethanol; correct
• 2 gallons of E85 fuel with 85% ethanol
RATIONALE
We will use the variables and to represent
the types of fuel: represents the gallons of
10% ethanol gas, and represents the gallons
of 85% gas. The first equation is the total
amount of gas Kevin will use to fill up his car.
He can use the two types of fuel, and together,
he puts gallons of gas in his car, so this can
be expressed as . The second
equation will represent the amount of ethanol
from the two fuels.Since we have two equations that represent this
equation, one way to solve is to use substitution
to rewrite one variable in terms of the other, and
solve one variable at a time. Let's take a look at
the second equation.
In equation , subtracting from both
sides gives us . We can use this in
the other equation to write as .
The coefficient to is because that is the
ethanol fuel. The coefficient to is
because that is the ethanol fuel. Finally,
he wants to have 10 gallons of ethanol,
which can be expressed as times . We
now need to solve this system of equations.
times is . Now, combine like terms
on the left side.
This is the other equation in the system, but
has been replaced with an equivalent
expression of . Now this is a singlevariable equation and we can solve for . First,
distribute into .
times is and times is .
Next, evaluate the multiplication on the right
side.CONCEPT
Solving Mixture Problems using a System of Equations
18
Consider the equation .
Which of the following is a graph of this equation?
D is correct
We can combine and to get
. Next, subtract from both sides.
minus equals . Finally, divide both
sides by .
This also means he uses gallons of
ethanol fuel because he uses gallons total.
divided by is equal to . Because
represents the gallons of ethanol fuel,
Kevin fills his car with gallons of ethanol
fuel.•
•
•
•
RATIONALE
When given the equation , we
can determine the slope and y-intercept.
Remember, if an equation is in the form
, the slope, , is the
coefficient in front of and the y-intercept
is .This graph is one of two options that has
a y-intercept at . The other graphs
have y-intercepts at . To ensure
that this graph matches the line, we can
confirm the slope. Remember, slope can
be expressed as rise/run. Rise is the
vertical change, or change in the value.
Run is the horizontal change, or change
in value. A slope of tells us that the
rise is and the run will be . Starting
at , go down three and to the right
one to get the point . These two
points connect to make the following line.
In a slope-intercept equation,
represents the y-coordinate of the yintercept and the x-coordinate is always
zero. This means that the coordinates of
the y-intercept are ). The coefficient
in front of is , so the slope is .
With this information, look for a graph that
has the y-intercept at and a slope
of . [Show Less]