UTA 5366 / UTA5366
Research
Week 5 Quiz
Score for this quiz: 90 out of 100
I highlighted the Answers. Unsure of the correct answer for 2 of them.
... [Show More]
Question 1
5 / 5 pts
A Family Nurse Practitioner believes that he has developed an intervention that can accelerate weight loss in adults with Type II diabetes when administered with a healthy diet. He recruits 25 participants from a local church. He obtains each participant’s weight prior to beginning the intervention (of a walking program alternating with resistance training). After a month of the treatment, all of the participants are weighed again. Which statistical test should the researcher select to determine the effect of his intervention on weight loss?
A. Independent samples t-test
B. Pearson’s correlation coefficient (r)
C. Paired t-test
page 583
Question 2
5 / 5 pts
A nurse in a cardiovascular ICU developed an intervention that she believes can reduce patient time on the ventilator post-operatively. She recruits study participants from the offices of cardiovascular surgeons. She randomizes the participants to two groups, a treatment group and a control group. She provides a novel teaching intervention along with a spirometer to each participant in the treatment group one week prior to their surgery. Participants in the control group received customary care. After each participant’s surgery, the researcher records the number of hours that they are on the ventilator post-operatively. Which statistical test should she select to determine the effects of her intervention on time spent on ventilator post-operatively?
A. Independent samples t-test
B. Pearson’s correlation coefficient (r)
C. Paired t-test
page 581
Question 3
5 / 5 pts
A nurse is reading a journal article on the effects of patient incivility on nursing burn-out. The results of the study were r = 0.50, p = .04 (with alpha set at .05). The nurse correctly summarizes that:
A. there is a weak relationship between patient incivility and nursing burn-out.
B. there is no relationship between patient incivility and nursing burn-out.
C. there is a moderate relationship between patient incivility and nursing burn-out.
Page 561
Question 4
5 / 5 pts
The imported question text for this question was too long.
A. True
B. False
page 581
Question 5
5 / 5 pts
A researcher wants to examine the relationship between post-partum depression and maternal age. She recruits 50 women who have given birth within the last 3 months from the WIC (Women, Infants, & Children Food and Nutrition) office. She collects demographic information from each woman (including age, race/ethnicity, and educational achievement) as well as administering a post-partum depression survey. Which of the following statistical tests should she select for her analysis?
A. Independent samples t-test
B. Pearson’s correlation coefficient (r)
C. Chi-square
page 561
Question 6
5 / 5 pts
Frequency distributions are a type of______________.
A. descriptive statistic
B. post hoc analysis
C. inferential statistic
page 550
Question 7
5 / 5 pts
A group of researchers studied functional impairment scores in a group of 10 patients before and after a new rehabilitation intervention. The researchers set the alpha at 0.05 which meant that the critical t value would be 2.26 (9 df). Data analysis showed
t(9)=2.84, p=.045. What do these results mean?
A. There was a statistically significant difference between the functional impairment scores obtained before and after the intervention.
B. There is insufficient information to determine if a significant difference exists between scores.
C. There was not a statistically significant difference between the functional impairment scores obtained before and after the intervention.
page 580
Question 8
5 / 5 pts
In a study, a researcher finds that as A increases, B also increases. The analysis shows that the strength of the relationship is 0.78. What type of linear relationship is this?
A. negative
B. positive
C. inverse
page 561
IncorrectQuestion 9
0 / 5 pts
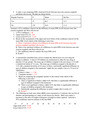
Kugler and colleagues (2005) studied the correlation between diet and biochemical/biological outcomes in hemodialysis patients. They set their alpha at 0.01. Here are their published results:
Potassium
r (p)
Phosphate
r (p)
Albumin
r (p)
Frequency of diet nonadherence
Not sig
.104(.002)
.221(.0001)
Degree of diet nonadherence
.109(.001)
.072(.030)
.206(.0001)
Frequency of fluid nonadherence
.082(.013)
.120(.0001)
.109(.015)
Degree of fluid nonadherence
.092(.005)
.099(.003)
.180(.0001)
What is the relationship between degree of diet nonadherence and albumin levels?
A. significant, strong relationship
B. significant, weak relationship
C. insignificant, moderate relationship
page 561
IncorrectQuestion 10
0 / 5 pts
In a research study on number of hours parents spent at children’s sporting events and number of incarcerations that the offspring experienced by age 30, the calculated Pearson’s r was –.95. What does this Pearson’s value signify?
A. As the hours of parents spent at children’s sporting events increased, the number of incarcerations that the offspring experienced by age 30 declined
B. As the hours of parents spent at children’s sporting events increased, the number of incarcerations that the offspring experienced by age 30 increased
C. There was no relationship between the number hours of parents spent at children’s sporting events and the number of incarcerations that the offspring experienced by age 30
page 561
Question 11
5 / 5 pts
What does bivariate correlational analysis do?
A. Measures the strength of multiple relationships connected with a concept
B. Provides an idea of which variable causes the other one
C. Measures the strength of the relationship between two variables
page 561
Question 12
5 / 5 pts
Which of the following correlation coefficients shows the strongest relationship?
A. –.85
B. .80
C. .10
page 561
Question 13
5 / 5 pts
Which of the following tests is essentially a comparison of means?
A. t-test
B. Pearson's correlation
C. Chi-square
One of the most common parametric analyses used to test for significant differences between group means of two samples is the t-test. In its calculation, the numerator is the difference scores of the means of the two samples. In addition, the test uses the pooled standard deviation of the two samples as the denominator.
Question 14
5 / 5 pts
Which statement is true about chi-square analysis?
A. It has the assumption of a normal distribution
B. It is a parametric test.
C. It is used for two nominal variables
page 587
Question 15
5 / 5 pts
A group of 15 nurses was asked which of two types of coffee they preferred. Seven of the nurses preferred the first type, while eight of the nurses preferred the second type. Which statistical test would be appropriate to determine differences in these two groups?
A. Chi-square
B. paired t-test
C. parametric test
page 587
Question 16
5 / 5 pts
Descriptive statistics should be reported in every study for which of the following reasons?
A. To determine validity
B. As an indication of reliability
C. To show the sample characteristics
D. To provide a powerful analysis of data
page 550
Question 17
5 / 5 pts
When there is an outlier in the data set, which measure of central tendency is effected the most?
A. Mode
B. Median
C. Mean
page 553
Question 18
5 / 5 pts
Which of the following measures is the most helpful both for providing a quantification of dispersion and for providing a way to interpret how far away from the mean each individual score is?
A. Range
B. Difference scores
C. Magnitude
D. Standard deviation
page 554
Question 19
5 / 5 pts
The statistical procedure most commonly used for prediction is _____________.
A. Chi-square test of independence
B. t-test
C. standard deviation
D. regression analysis
page 570
Question 20
5 / 5 pts
A researcher collects a nationally based set of data about cholesterol levels and age at first circulatory incident (myocardial infarction or cerebrovascular accident). The researcher performs a linear regression analysis to find out all of the following except:
A. Estimate the age at which circulatory incidents are likely to occur, given the cholesterol level.
B. Determine whether there is a linear relationship between cholesterol levels and circulatory incidents.
C. Determine if there are differences between the cholesterol levels and the number of circulatory incidents.
Calculate the strength of the relationship between cholesterol levels and circulatory incidents.
page 571 [Show Less]