Question 2 Chapter 17 Money supply, money demand, and adjustment to monetary equilibrium
2. Money supply, money demand, and adjustment to monetary
... [Show More] equilibrium
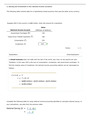
The following table shows a money demand schedule, which is the quantity of money demanded at various
price levels (P).
Fill in the Value of Money column in the following table.
Price Level (P) Value of Money (1/P)
1.00
1.33
2.00
4.00
Quantity of Money Demanded
(Billions of dollars)
1.5
2.0
3.5
7.0
Points: 1 / 1
Now consider the relationship between the price level and the quantity of money that people demand. The
lower the price level, the money the typical transaction requires, and the money people
will wish to hold in the form of currency or demand deposits.
Points: 0.5 / 1
Explanation: Close Explanation
The price level (P) is the price of goods and services measured in terms of money. The value of money
(1/P) is the value of money measured in terms of goods and services. For example, when the price
level is 1.33, the value of money is . The following table shows that the value of money
declines as the price level rises. That is, as the prices of goods and services rise, the number of goods
and services that can be purchased with one dollar declines.
0.75
0.50
0.25
less less
Price Level (P) Value of Money (1/P)
Quantity of Money Demanded
(Billions of dollars)
1.00 1.00 1.5
1.33 0.75 2.0
2.00 0.50 3.5
4.00 0.25 7.0
VALUE OF MONEY
Assume that the Fed initially fixes the quantity of money supplied at $3.5 billion.
Use the orange line (square symbol) to plot the initial money supply ( ) set by the Fed. Then, referring to
the previous table, use the blue connected points (circle symbol) to graph the money demandcurve.
Correct Answer
1.25
1.00
0.75
0.50
0.25
0
0 1 2 3 4 5 6 7 8
QUANTITY OF MONEY (BiIIions of doIIars)
MS1
Money Demand
MS2
The table also shows the positive relationship between the price level and the quantity of money
demanded. As the price level rises (and the value of money falls), the typical transaction requires more
money, and people will need to hold a larger quantity of money in the form of currency and demand
deposits in order to conduct day-to-day transactions. Conversely, as the price level falls (and the value
of money rises), the typical transaction requires less money, and people will need to hold a smaller
quantity of money to conduct day-to-day transactions.
Your Answer
Explanation: Close Explanation
When the Fed fixes the quantity of money, the money supply curve is a vertical line at the quantity it
selects—in this case, $3.5 billion. The money demand curve slopes downward, passing through each
combination from the table of the value of money and the quantity of money demanded. For example,
when the value of money is 1.00, the quantity of money demanded is $1.5 billion. You should have
plotted the first point on the money demand curve at the coordinate (1.5, 1.00), the second at (2,
0.75), the third at (3.5, 0.50), and the fourth at (7, 0.25).
At the intersection of the money supply and money demand curves, the equilibrium quantity of money
is $3.5 billion, the equilibrium value of money (1/P) is 0.50, and the equilibrium price level is 2.00.
Points: 0.33 / 1
According to your graph, the equilibrium value of money is
.
, therefore the equilibrium price level is
Points: 1 / 1
Now, suppose that the Fed increases the money supply from the initial level of $3.5 billion to $7 billion.
In order to increase the money supply, the Fed can use open-market operations to
public.
the
Points: 0 / 1
Use the purple line (diamond symbol) to plot the new money supply ( ).
0.50
2.00
buy bonds from
greater
rise
fall
At the initial equilibrium value of money and price level, the quantity of money supplied is now
than the quantity of money demanded. This expansion in the money supply will
people's demand for goods and services. In the long run, since the economy's ability to
produce goods and services has not changed, the prices of goods and services will and the value of
money will .
Points: 1 / 1
Explanation: Close Explanation
In order to increase the money supply, the Fed uses open-market operations to buy bonds from the
public. By buying bonds, the Fed takes bonds from the public and replaces them with money, thereby
increasing the amount of money in circulation. The new money supply curve is a vertical line at $7
billion.
Explanation: Close Explanation
At the initial value of money (0.50) and the initial price level (2.00), the quantity of money supplied is
now greater than the quantity of money demanded. The increase in the supply of money causes the
demand for goods and services to rise but does not impact the economy's long-run productive capacity.
In the long run, the increase in demand leads to higher prices for products, with no change in the
number of products produced. As a result, one dollar will buy fewer goods and services than before the
monetary expansion—in other words, the value of money falls.
increase [Show Less]