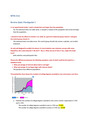
MTH216 Checkpoint 1 Complete Solution
In my experimental study, I used a sample that was larger than the population.
No, the statement does not make
... [Show More] sense. A sample is a subset of the population and cannot be larger than the population.
I wanted to test the effects of vitamin C on colds, so I gave the treatment group vitamin C and gave the control group vitamin D.
The statement does not make sense. The control group should only receive a placebo, not another treatment.
An exit poll designed to predict the winner of a local election uses voluntary surveys with every Republican who votes between 9 :00 and 9 : 30a.m. What sources of bias, if any, might this study have?
Both selection and participation bias
Discuss the differences between the following questions, each of which could be the basis for a statistical study.
• What percentage of Internet dates lead to marriage?
• What percentage of marriages begin with Internet dates?
The questions have different populations.
The stacked line chart shows the numbers of college degrees awarded to men and women over time.
a. Estimate the numbers of college degrees awarded to men and to women (separately) in 1930 and in 1990.
The number of college degrees awarded to men in 1930 was 75,000.
The number of college degrees awarded to women in 1930 was 50,000
The number of college degrees awarded to men in 1990 was 563,000. The number of college degrees awarded to women in 1990 was 571,500.
b. Compare the numbers of degrees awarded to men and to women (separately) in 1980 and 2000. Choose the correct answer below.
In 1980, more men than women received degrees; in 2000, more women than men received degrees.
c. During what decade did the total number of degrees awarded increase the most?
1960
d. Compare the total numbers of degrees awarded in 1950 and 2000.
The total number of degrees awarded in 1950 was 444,000.
The total number of degrees awarded in 2000 was 1,219,000.
Consider the scatterplot to the right.
a. State whether the diagram shows a positive correlation, a negative correlation, or no correlation. If there is a positive or negative correlation, is it strong or weak?
b. Summarize any conclusions that can be drawn from the diagram.
a. There is a weak positive correlation.
b. Higher AGI may imply slightly higher charitable giving as a percentage of AGI.
For the following pair of variables, state the units that might be used to measure each variable. Then state whether you believe that they are correlated. If you believe they are correlated, state whether the correlation is positive or negative. Explain your reasoning.
Latitude north of the equator and the average length of daylight in December
To measure latitude, the unit degrees of latitude might be used.
To measure length of daylight, the unit hours might be used.
What correlation, if any, is there between the variables?
There is a negative correlation because the average length of daylight tends to increase when latitude decreases.
For the following pair of variables, state the units that might be used to measure each variable. Then state whether you believe that the two variables are correlated. If you believe they are correlated, state whether the correlation is positive or negative. Explain your reasoning.
The heights and weights of 50 randomly selected females between the ages of 1 and 21.
To measure height, the unit feet might be used.
To measure weight, the unit pounds might be used.
What correlation, if any, is there between the variables?
There is a positive correlation because women's weights tends to increase when height increases.
The table to the right gives the per capita gross national product and the per capita expenditure on defense for eight developed countries. Gross domestic product (GDP) is a measure of the total economic output of a country in monetary terms. Per capita GDP is the GDP averaged over every person in the country. Complete parts a though c.
State whether the two variables appear to be correlated, and if so, state whether the correlation is positive, negative, strong, or weak.
The two variables appear to be correlated and the correlation is strong and positive
Suggest a reason for the correlation or lack of correlation.
The higher a country's per capita GDP, the more it can spend on per capita national defense [Show Less]