MATH 225N Week 2 Assignment: Frequency Tables Questions and Answers
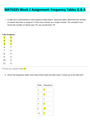
1. A data set is summarized in the frequency table below. Using the table, determine
... [Show More] the number of values less than or equal to 5. Give your answer as a single number. For example if you found the number of values was 19, you would enter 19.
Value Frequency
3 9
4 4
5 3
6 7
7 6
8 3
9 3
10 5
11 4
________________________________________
Provide your answer below: 16
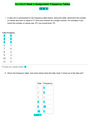
1. Given the frequency table, how many times does the data value 3 show up in the data set?
Data Frequency
1 3
3 5
4 2
6 3
8 11
10 3
Answer : 5
2. A group of students were surveyed about the number of siblings they have. The frequencies and relative frequencies of their responses are shown in the below.
Complete the cumulative relative frequency table.
Number of Siblings Relative Frequency
0 0.18
1 0.33
2 0.16
3 0.14
4 or more 0.19
________________________________________
Provide your answer below:.18, .51, .67, .81, 1.0
3. Given the relative frequency table below, which of the following is the corresponding cumulative relative frequency table?
Value
Frequency
4
0.35
5
0.2
6
0.05
7
0.4
HelpCopy to ClipboardDownload CSV
________________________________________
Select the correct answer below:
________________________________________
Value Frequency
4 0.3
5 0.6
6 0.65
7 1
Value Frequency
4 0.35
5 0.6
6 0.65
7 1
Value Frequency
4 0.3
5 0.55
6 0.6
7 1
Value Frequency
4 0.35
5 0.55
6 0.6
7 1
5. A group of students were surveyed about the number of books they read last summer. Their responses are summarized in the frequency table below.
How many students responded to the survey?
Number of Books Frequency
0−1 2
2−3 9
4−5 7
6−7 3
8−9 1
10 or more 2
________________________________________
Provide your answer below: 24
________________________________________
6.The ages of the students in an art class at the community center are listed below.
9,11,14,14,16,21,24,26,32,33,37,38,38,52,53,55
Complete the frequency table. 1,4,3,5,0,3
________________________________________
Yes that's right. Keep it up!
________________________________________
7. A data set is summarized in the frequency table below. Using the table, determine the number of values less than or equal to 7 in the data set. Give your answer as a single number. For example if you found the number of values was 16, you would enter 16.
Value Frequency
3 8
4 4
5 3
6 2
7 2
8 7
9 3
10 6
11 3
12 7
________________________________________
Provide your answer below: 19
8. A data set is summarized in the frequency table below. Using the table, determine the number of values less than or equal to 6. Give your answer as a single number. For example if you found the number of values was 14, you would enter 14.
Value Frequency
1 5
2 3
3 2
4 3
5 4
6 3
7 8
8 3
9 7
10 8
11 3
________________________________________
Provide your answer below: 20
9. As the manager of a store, you wish to determine the amount of money that people who visit this store are willing to spend on impulse buys on products placed near the checkout register. You sample twenty individuals and records their responses. Construct a frequency table for grouped data using five classes.
8,18,15,10,29,4,15,2,4,9,16,14,13,8,25,25,27,1,15,24
________________________________________
Provide your answer below:
lower Class Limit Upper Class Limit Frequency
1 6 4
7 12 4
13 18 7
19 24 1
25 30 4
10.As a member of a marketing team, you have been tasked with determining the number of DVDs that people have rented over the past six months. Their responses are summarized in the relative frequency table below.
What is the cumulative relative frequency of customers who rent 27 or fewer DVDs?
________________________________________
Provide your answer below: .85
________________________________________
Number of DVDs Rented Relative Frequency Cumulative Frequency
10-15 0.30 0.30
16-21 0.35 0.65
22-27 0.20
28-33 0.15 1.00
11. Given the relative frequency table below, which of the following is the corresponding cumulative relative frequency table?
"Value " " Frequency "
"4 " " 0.28 "
"5 " " 0.24 "
"6 " " 0.04 "
"7 " " 0.2 "
"8 " " 0.24 "
________________________________________
Select the correct answer below:
________________________________________
Value Frequency
4 0.28
5 0.6
6 0.68
7 0.84
8 1
Value Frequency
4 0.28
5 0.6
6 0.64
7 0.84
8 1
Value Frequency
4 0.28
5 0.52
6 0.56
7 0.76
8 1
Value Frequency
4 0.28
5 0.56
6 0.6
7 0.8
8 1
12. Several executives were asked how many suits they own. The results are tabulated in the following frequency table.
Which histogram accurately summarizes the data?
"Value " " Frequency "
"8 " " 6 "
"9 " " 5 "
"10 " " 3 "
"11 " " 5 "
"12 " " 3 "
"13 " " 2 "
________________________________________
Select the correct answer below:
________________________________________
13. Describe the shape of the given histogram.
________________________________________
Select the correct answer below:
________________________________________
uniform
unimodal and symmetric
unimodal and left-skewed
unimodal and right-skewed
Bimodal
14. Several people were asked to report the number of hours of sleep they average per night. The results are shown in the histogram below. How many of those people average between 4.5 and 6.5 hours of sleep per night?
Provide your answer below: 11
________________________________________
$$
15. Describe the shape of the given histogram.
________________________________________
Select the correct answer below:
________________________________________
uniform
unimodal and symmetric
unimodal and left-skewed
unimodal and right-skewed
bimodal
16. The histogram below represents the prices of digital SLR camera models at a store. Describe the shape of the distribution.
Select the correct answer below:
________________________________________
uniform
unimodal and symmetric
unimodal and left-skewed
unimodal and right-skewed
Bimodal
17. Given the following histogram for a set of data, how many values in the data set are between 5.5 and 8.5?
________________________________________
Provide your answer below: 17
18. Describe the shape of the given histogram.
________________________________________
Select the correct answer below:
________________________________________
uniform
unimodal and symmetric
unimodal and left-skewed
unimodal and right-skewed
Bimodal
19. A professor gave students a test, and the distribution of the scores of the students is shown in the histogram below. What shape does the distribution have?
________________________________________
Select the correct answer below:
________________________________________
uniform
unimodal and symmetric
unimodal and left-skewed
unimodal and right-skewed
Bimodal
20. The author of a book wants to know what price his book is being sold for. He gets the price from all the bookstores in a city and creates a histogram of the results. What is the shape of the distribution?
________________________________________
Select the correct answer below:
________________________________________
uniform
unimodal and symmetric
unimodal and left-skewed
unimodal and right-skewed
bimodal
21. Given the following histogram for a set of data, how many values in the data set are between 7.5 and 9.5?
________________________________________
Provide your answer below: 4
22. Gail is a car salesperson, who keeps track of her sales over time. The line graph below shows the data for the number of cars she sells per week.
At what week were her sales 8? Do not include the unit in your answer.
________________________________________
Provide your answer below: 5
23. Porter is keeping track of the total number of books he has read over time. The line graph below shows the data.
How many books did Porter read from month 2 to 5? Do not include the unit in your answer.
________________________________________
Provide your answer below: 11-4 = 7
24. The bar graph below shows the number of men and women in different classes.
How many total students are in the computer science class? Do not include the units in your answer.
________________________________________
Provide your answer below: 29
25. The bar graph below shows the number of men and women in different classes.
A side-by-side bar graph has a horizontal axis labeled Classes with groups Chemistry and Law and a vertical axis labeled Students from 0 to 14 in increments of 2. There are two vertical bars over each horizontal axis label, with the bar on the left representing men and the bar on the right representing women. The heights of the bars are as follows, with the horizontal axis label listed first and the bar heights listed second from left to right: Chemistry, 14 and 11; and Law, 12 and 13.
How many total students are in the Chemistry class? Do not include the units in your answer.
________________________________________
Provide your answer below: 25
26. An accounting manager is conducting research on how many times each accountant in the office checks their work. The following table shows the number of times each accountant checks their work.
Check Work Frequency
None 6
Once 3
Twice 2
Three times 0
Four times 0
27. The accounting manager encourages accountants to check their work at least two times to ensure there are no calculation errors. According to the data above, should the accounting manager be concerned about errors made in the work conducted at the office?
________________________________________
Select the correct answer below:
________________________________________
No, the accounting manager should not be concerned because everyone in the office is checking their work at least two times.
No, the accounting manager should not be concerned because everyone in the office is checking their work at least three times.
Yes, the accounting manager should be concerned because no one in the office is checking their work.
Yes, the accounting manager should be concerned because a majority of employees are not checking their work.
28. Jackie invited her friends over for a movie night. She asked each of her friends coming over about their favorite movie snack. The following table shows the favorite movie snacks of her friends.
Movie Snack Frequency
Popcorn 14
Nachos 3
Candy 8
Pizza 6
Chips 3
Ice Cream 2
29. If Jackie can only get two movie snacks for a movie night with her friends, which two movie snacks should she purchase?
________________________________________
Select the correct answer below:
________________________________________
According to the data, Jackie should purchase popcorn and candy.
According to the data, Jackie should purchase nachos and candy.
According to the data, Jackie should purchase pizza and chips.
According to the data, Jackie should purchase ice cream and chips.
30. Marc is keeping track of the total number of movies he has watched over time. The line graph below shows the data where the number of movies corresponds to the number of movies that had been watched at the beginning of the week shown on the horizontal axis.
How many movies did Marc watch between the beginning of week 1 and the beginning of week 5? Do not include the unit in your answer.
________________________________________
Provide your answer below: 7
31. Josslyn is a car salesperson who keeps track of her sales over time. The line graph below shows how many cars she sells per week.
What was the change in cars sold from week 2 to 6? Do not include the unit in your answer.
________________________________________
Provide your answer below: -8 (negative 8)
32. A set of data is summarized by the stem and leaf plot below.
Stem1234Leaf1356671123348900002367788811122334567777
________________________________________
Provide your answer below:
________________________________________
There are 8 values in the data set which are greater than or equal to 20 and less than or equal to 29. There are 6 values in the data set which are greater than or equal to 10 and less than or equal to 19. There are 14 values in the data set which are greater than or equal to 40 and less than or equal to 49.
33. A set of data is summarized by the stem and leaf plot below.
Stem1234Leaf000011223445899990123667788890000001345567999923335567777889
Which of the following statements are true? Select all correct answers.
________________________________________
Select all that apply:
________________________________________
•
The value 18 appears 0 times in the data set.
• ________________________________________
•
The value 39 appears 4 times in the data set.
• ________________________________________
•
The value 21 appears 2 times in the data set.
• ________________________________________
•
The value 37 appears 0 times in the data set.
• ________________________________________
•
The value 42 appears 1 time in the data set.
• ________________________________________
•
The value 22 appears 1 time in the data set.
34. A set of data is summarized by the stem and leaf plot below.
Stem12Leaf11223344667789126899
________________________________________
Provide your answer below:
________________________________________
There are 6 values in the data set which are greater than or equal to 20 and less than or equal to 29. There are 14 values in the data set which are greater than or equal to 10 and less than or equal to 19.
35. [Show Less]